





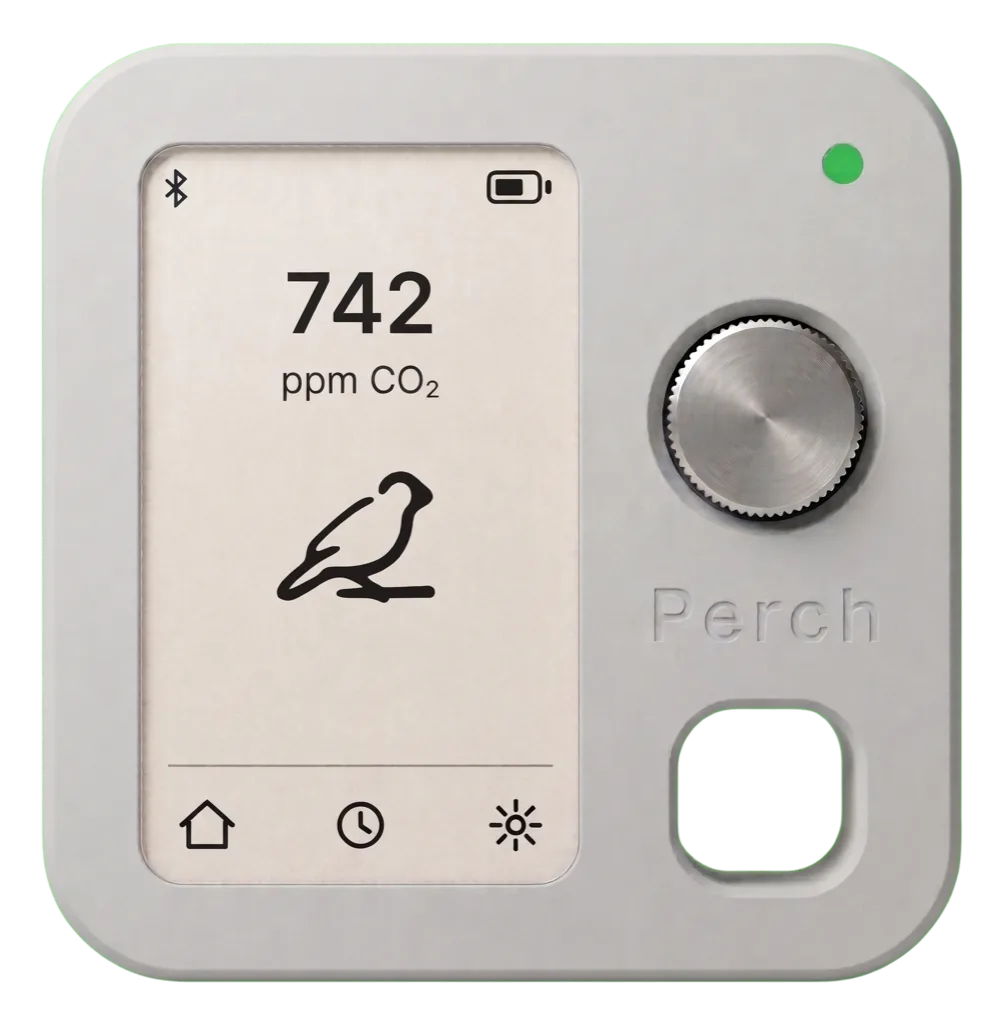

Lab-grade sensing, clip-on size
A Sensirion SEN66 core measures PM1–10, CO₂, VOCs, NOx, temperature and humidity — plus a barometer and GPS.
Environmental health platform
A portable sensor, proprietary scores and an AI companion for everything you can’t see that affects how you feel and perform.
$179 clip-on device · No subscription
One device. Every signal.
Meet Perch
Oura and Whoop proved the playbook for physiological metrics. Perch runs it for environmental ones — CO₂, particulates, VOCs, NOx, pressure, temperature and humidity.
A Sensirion SEN66 core measures PM1–10, CO₂, VOCs, NOx, temperature and humidity — plus a barometer and GPS.
CognAir, SleepAir, FitAir and HealthAir turn raw air into research-based scores that personalize with use.

Built for people with allergies, asthma, migraine, eczema, arthritis and MS — see which conditions tend to precede a flare.
Log how you feel in seconds. Perch cross-references your exposure to surface patterns — not diagnoses.

Plain-language analyses and recommendations, grounded in your own measured environment.
E-ink display, multi-day battery and a carabiner loop. Pairs and syncs with the app over BLE.
How it works
The clip-on sensor follows you. GPS and BLE tie every reading to your spaces — bedroom, car, office, the morning run.
CognAir, SleepAir, FitAir and HealthAir turn raw air into research-based, patent-pending scores that personalize with use.
Plain-language AI analyses and recommendations. Log symptoms and Perch cross-references your exposure to surface triggers.
For campuses & teams
Perch fleets give universities, employers and researchers street-levelStreet-level indoor and outdoor environmental data from real people’s days — live on the Perch Map and through our API. Campus betas are forming now.

Stay in the loop
Launch news, campus-beta invites and early-supporter pricing. A few emails a year — unsubscribe anytime.